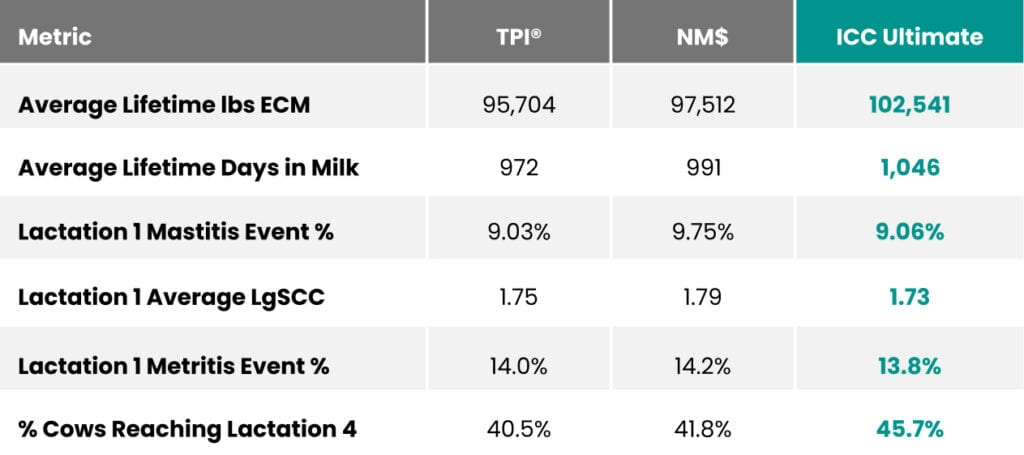
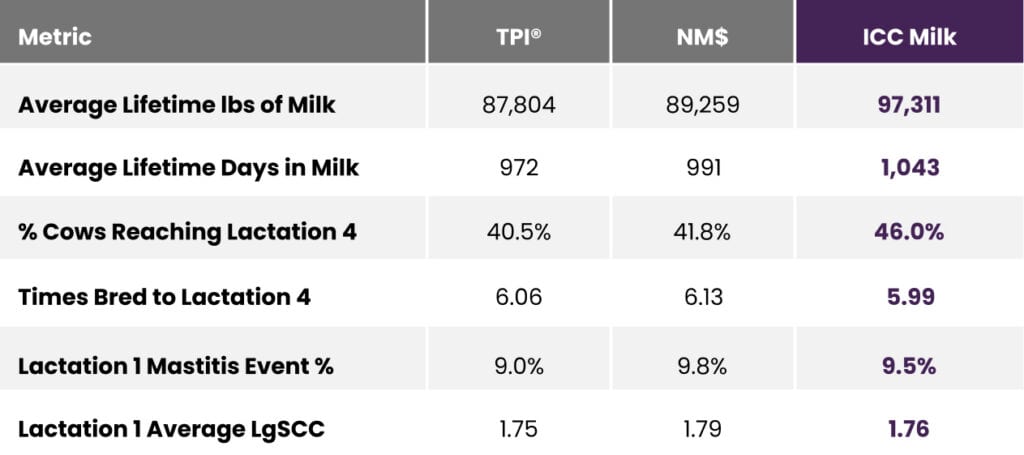
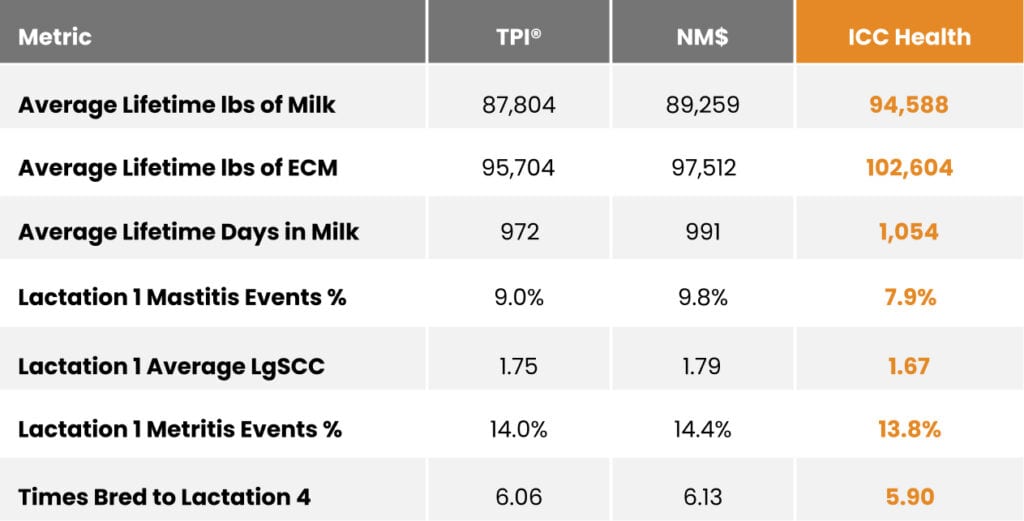
The Holstein ICC indexes are validated using data from 45,000 genomic-tested females in progressive commercial herds tracked from birth through the end of their productive life.
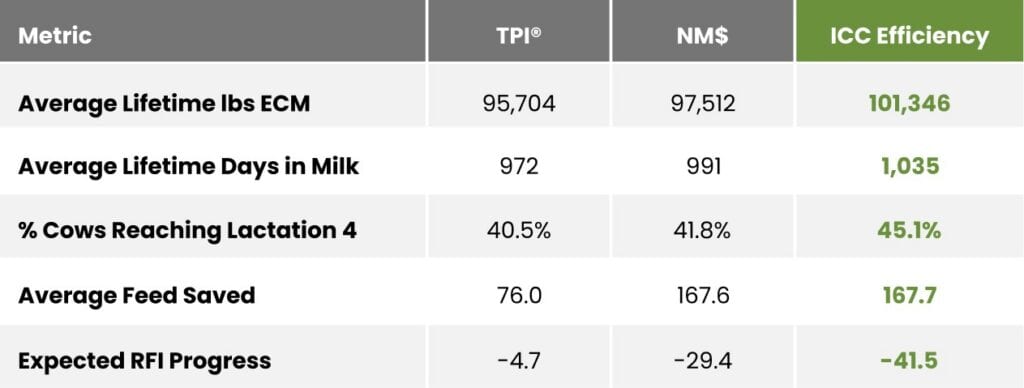
To compare performance, the same 45,000 cows were ranked by each index. The top 25% for each index was then evaluated based on actual lifetime results for production, fertility, health and longevity. Because it’s the same cows, simply sorted differently, the comparisons show how each index actually performs in real herds.